Introduction
Whenever a developer or system admin faces an issue with the system, the first instinct is to look at the logs. For a long time, we have relied on basic tools like grep, awk, or perl to perform log analysis. However, with changing times and cloud-scale applications, the earlier techniques no longer suffice. Imagine a system with tens, hundreds, or thousands of hosts. There are multiple instances of different applications running on all these hosts. To make things more interesting, these hosts may not be located at the same location, and we may have to deal with millions of lines in logs. In such a world, it is not possible to troubleshoot problems by using earlier-used tools or just looking at one particular host. We need a centralized place to store all logs from all hosts, finds out what is going on by searching or visualizing logs and that’s where Elasticsearch fits well. In this tutorial, we are going to store Java application’s log in Elasticsearch using Apache Logging.
Brief definition
What is Elasticsearch?
Elasticsearch is a search server based on Apache Lucene. It provides real-time, distributed, multitenant-capable, full-text search engine capability. It provides a RESTful API using JSON documents. It can be used for full-text search, structured search, analytics, or a combination of all three. One of its key features is the ability to search fast by indexing the text to be searched.
What is Filebeat?
Filebeat is a lightweight shipper for forwarding and centralizing log data. Installed as an agent on your servers, Filebeat monitors the log files or locations that you specify, collects log events, and forwards them to either to Elasticsearch or Logstash for indexing.
What is Kibana?
Kibana is an open source analytics and visualization platform that works on top of Elasticsearch. It can be used to search, view, and interact with any structured or unstructured data stored in Elasticsearch. It facilitates advanced data analysis seamlessly and enables visualization of data in a variety of histograms, charts, graphs, tables, and maps.
Sending logs directly to Elasticsearch
In our first solution, we send logs directly to Elasticsearch. Because Elasticsearch, provides RESTful API, we can use HttpAppender to contact with Elasticsearch. Here is a sample log4j2.xml to send your logs directly to ES:
<?xml version="1.0" encoding="UTF-8"?>
<Configuration status="INFO">
    <Appenders>
        <Http name="Http" url="http://localhost:9200/applogs/_doc">
            <Property name="Content-Type" value="application/json" />
            <PatternLayout pattern='{"date":%d{ISO8601},"thread":"[%t]","level":"%-5level","logger":"%logger{36}","message":"%msg"}' />
        </Http>
    </Appenders>

    <Loggers>
        <Root level="info">
            <AppenderRef ref="Http" />
        </Root>
    </Loggers>
</Configuration>
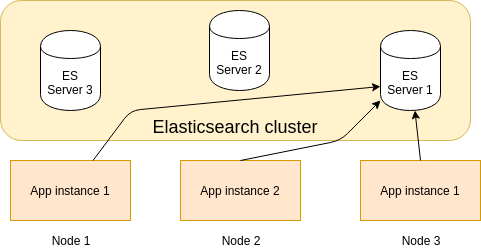
It sends logs to index named applogs. It is a simple solution but it has some drawbacks:
- It will slow down your application, because it tries to connect to remote server (Elastic server).
- Because you can just provide one url in HttpAppender, then you will connect to one of the the ES nodes. If this node goes down, your logs will not save to ES. To workaround this problem, you can use the load balancer but it will not solve the slowness of the application caused by http requests.
The picture blow depicts this solution:
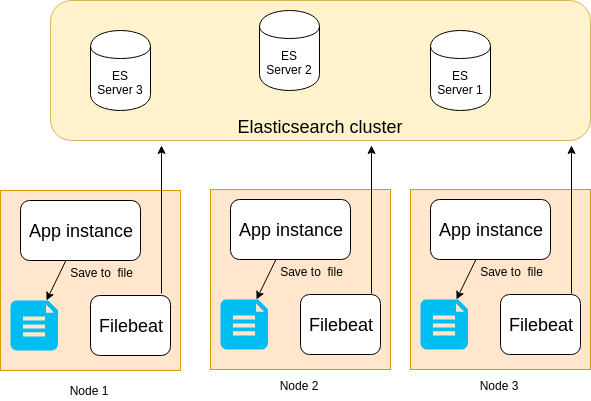
Sending logs indirectly using filebeat
For performance reason, instead of invoking http request each time, we save our logs locally in a file and we use filebeat to send these logs to Elasticeasrch. In this solution in each node we should install and run filebaet. Here is the log4j2.xml configuration to persist logs in a file:
<?xml version="1.0" encoding="UTF-8"?>
<Configuration status="INFO">
    <Appenders>
        <File name="File" fileName="/var/log/yourApp/app.log" append="true">
            <PatternLayout pattern='{"date":%d{ISO8601},"thread":"[%t]","level":"%-5level","logger":"%logger{36}","message":"%msg"}%n' />
        </File>
    </Appenders>

    <Loggers>
        <Root level="info">
            <AppenderRef ref="File"/>
        </Root>
    </Loggers>
</Configuration>
and this is a filebeat.yml configuration to send logs to Elasticsearch:
filebeat:
  prospectors:
    -
      paths:
        - /var/log/yourApp/app.log
      type: log

output:
  elasticsearch:
    hosts: ["http://localhost:9200"]
run filebeat:
./filebeat run
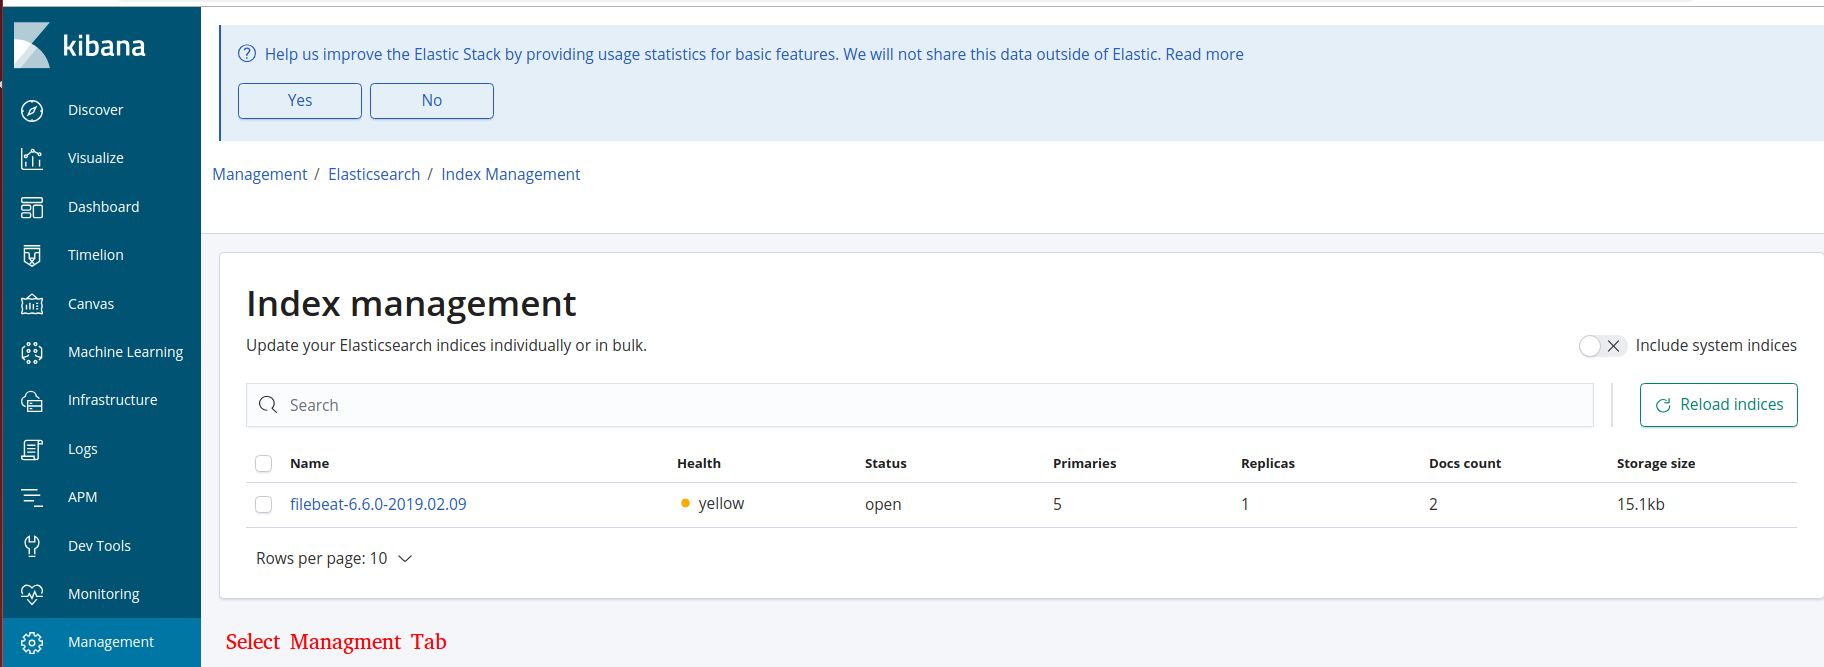
You can check the created index in Kibana. The default pattern looks like filebeat-%{[agent.version]}-%{+yyyy.MM.dd}:
Pros and cons
Using filebeat brings some advantages over HttpAppender:
- It will not slow down your application because it writes logs to local file instead of sending it over HTTP
- In contrast to HttpAppender that you forced to set only one URL, you can set more than one ES nodes in filebeat.yml, increasing resiliency and fault tolerant
- If the entire clsuter of Elasticsearch is down, you won’t loss any log because Filebeat keeps track of the last lines sent and will continue reading the files as soon as the Elasticsearch becomes available again
- Filebeat stores all it’s state in a file called registry, so when filebeat is restarted it uses registry file to rebuild the state, and continues from the last known position
- Garantee at least once delivery
Disadvantages
- Needs more effort. You should install additional softwate (filebeat) in each node.
- If filebeat’s state (registry) is deleted, all logs will re-send to the Elasticsearch again.